Read Technical Analysis – Price Action Trading (Part 1)
What is a candle?

Select the candle chart option on your MT4 platform when you open up your charts.
Candle Patterns
In this section we’re going to take a look at trading off Forex candles on your MT4 charts. There are many different Forex candle patterns – we’ll have a look at some of the more common and reliable ones here. Candle patterns often indicate a turning point or reversal in the Forex market, so we’ll break this section up into ‘Bearish Reversal Candles’ and ‘Bullish Reversal Candles’.
Bearish Reversal Candles
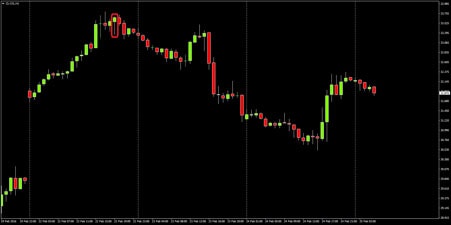
Shooting Star:

The Shooting Star is a single candle bearish reversal pattern that occurs at the end of an uptrend. Price initially moves higher, before eventually closing near the open, leaving a long wick with a short body. Wick should be at least 1.5x the length of the body. Note in the above example, this Forex candle leads to a decline of nearly 1000 pips in less than two weeks.
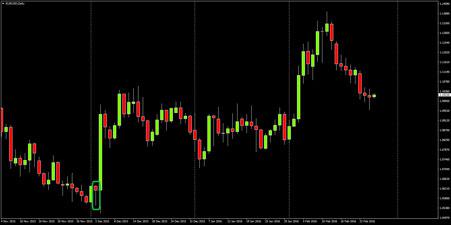
Bearish Engulfing:

The Bearish Engulfing is one of the more common bearish reversal and continuation patterns. The candle will close lower, with a body that completely engulfs the body of the relatively smaller previous candle. Note this candle continues to occur frequently throughout the down trend, signalling continuation (we have only circled two which occur at peaks).
Hanging Man:
The Hanging Man is another relatively common bearish reversal candle that occurs at peaks. Price will move signifcantly lower at the start of the perioid but will come back to finish near the open, leaving a long wick and small body (simmilar to the Shooting Star, but the wick is below the candle not above). If this Forex candle occurs in the lows of a down trend it is a bullish candle known as a hammer.
Bullish Reversal Candles
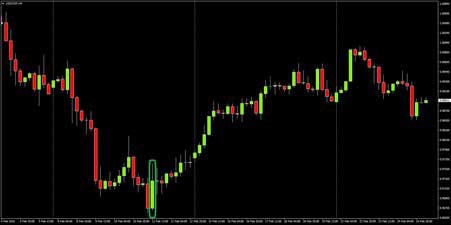
Bullish Hammer:
The Bullish Hammer is a common reversal pattern that looks identical to the Hanging Man candle but occurs in the bottoms of down trends. Price will move signifcantly lower at the start of the perioid but will come back to finish near the open, leaving a long wick and small body. Note in this example, the following candle actually breaches the Hammer’s low – Forex traders should always set their stop a reasonable distance from any reversal candle.
Bullish Engulfing:
The Bullish Engulfing is identical to the Bearish Engulfing but it is an up candle occuring at the end of a down trend. The body of the new candle will completely engulf the previous candles body signalling a major shift in sentiment.
These are just a few of the more common Forex candle patterns with high success rates. Remember some candles appear identical so you have to then determine whether the candle is appearing at a peak in an advance (Hanging Man) or at a trough in a decline (Bullish Hammer)?
Don’t forget to set your stops a safe distance from the relevant candle’s high/low – though many reversals are immediate, there is some times noise which you should adjust for.
Go back on your MT4 charts and see how many of each Forex candle pattern you can find and come up with a trading strategy around them.
Chart Patterns (Part 1)
In this section we will cover chart patterns, these are patterns that are comprised of many candles and take considerably more time to form. Once again, there are multitudes of chart patterns to draw up on your MT4 platform, so we will try to only cover the more common and reliable patterns.
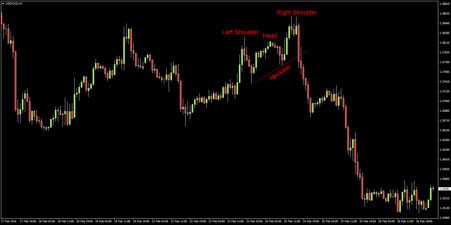
Head and Shoulders – Bearish Reversal Pattern
This is by far one of the most common and easy to recognise chart patterns, it is also the most reliable. Forex traders love these patterns for both their reliability and the fact they offer clear entry and stop loss levels:

These patterns have four components:
- Left Shoulder – small rounded top. Pattern is not yet visible
- Head – Pair breaks above the left shoulder before retracing 100%, or the majority of the ascent – potential pattern visible to the keen eyed chart trader
- Right Shoulder – pair forms a lower high to the right of the head, usually similar magnitude to left shoulder, but variance is not uncommon. Head and Shoulders top is now clearly visible.
- Neckline – Though the chart pattern is now clearly visible, it is not a confirmed top until there is a break below the neckline. The Neckline connects the lows of the left and right shoulders. This is often a straight line, though in the above example it is ascending – patterns with ascending necklines are even more reliable than the standard, flat neckline Head and houlders.
Once price breaches the neckline, the trader enters short. Stop can be placed above the right shoulder, or above the head (depending on your risk tolerance). Note that price often comes back to test the underside of the neckline – this can be very handy if you’ve missed the original break and reinforces bearish bias. In this example, once price breaches the neckline, there is a ecline of over 100 pips.
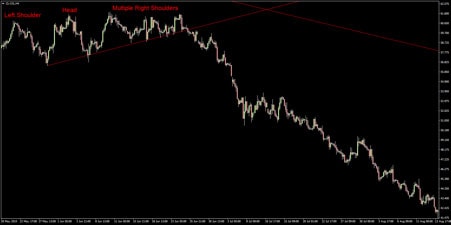
Deformed Head & Shoulders – the above example was very clean, though some times, these patterns can exhibit ‘deformities’ such as dual or multiple right shoulders, descending neck lines or shoulders that exceed the top.
Cleaner patters tend to be more reliable, though the key to a successful trade is always waiting til the pattern is confirmed ie the Neckline breaks. Here are some examples of the above deformities:

Head and Shoulders patterns are extremely reliable and offer the trader clear entry and exit points, but always remember – the setup is not confirmed until the neckline is breached.
Inverse Head and Shoulders – Bullish Reversal Pattern
As the name suggests, these patterns are identical to a standard Head and Shoulders, but appear upside down (on their heads) and signify a potential bottom. Not quite as reliable as the standard H&S, but still a very reliable pattern. These patterns are often more difficult to spot than their bearish counterparts, but recognition becomes easier as you gain charting experience.

Once again, the key here is waiting til the neckline is breached.
Double Top – Bearish Reversal Pattern
The Double Top or ‘M’, is another reliable chart pattern favoured by many traders. Like the H&S, it offers the trader clear entry and stop loss levels. With the Double Top, the entry trigger is known as the Confirmation Line:
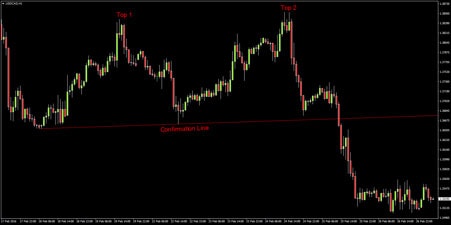
The Double Top is characterized by two tops of similar magnitudes, originating from roughly the same point. The Confirmation Line connects the two origin points and tends to be flat or ascending at a slight gradient. Just like the H&S, the trader does not enter short until the Confirmation Line is breached and the top is confirmed. Note the two tops often take the shape of H&S or smaller double top patterns (this M features the two H&S examples from earlier).
Double Bottom – Bullish Reversal Pattern
The Double Bottom or ‘W’ is the inverse of the Double Top – it’s shape is reminiscent of the letter ‘W’ and the pattern signals a potential bottom.
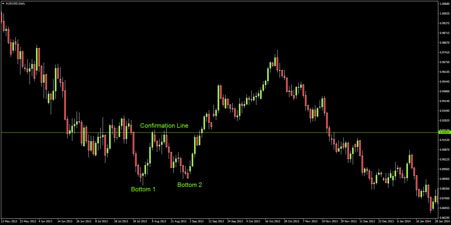
As with the other reversal patterns we’ve covered, the trader waits until the Confirmation Line is breached before entering a Buy position.
Chart Patterns (Part 2)
Ascending Triangle – Bullish Continuation Pattern:
The Ascending Triangle is one of the most reliable bullish continuation or accumulation patterns. It is characterized by a series of higher lows failing at a flat top – this means it is a ‘terminal’ pattern – eventually price will have to stop carving higher lows, or more often than not, the top will have to break.

Just like the reversal patterns discussed in the previous section, the buy signal occurs when the top breaks and the pattern is confirmed.
Descending Triangle – Bearish Continuation Pattern:
The Descending Triangle on the other hand, is a very reliable bearish continuation pattern. The pattern is characterized by a series of lower highs meeting a flat bottom.
Traders will enter short when the flat bottom is taken out. As we discussed in the Trend Trading section, price can decline quite quickly in a bear market – these patterns often yield impressive moves lower.
Bull Flag – Bullish Continuation Pattern:
Bull Flags or Pennants are an extremely reliable bullish continuation pattern. They are deceptive to the novice trader as price is temporarily trending down, but at a relatively shallow pace. Bull flags are characterized by a series of parallel lower highs and lower lows within a dominant uptrend:
A buy signal is triggered when the upper parallel is breached.
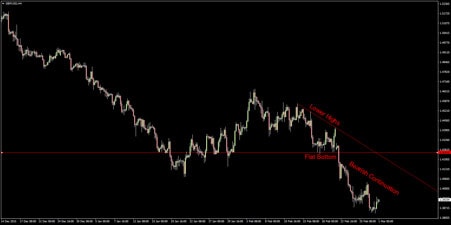
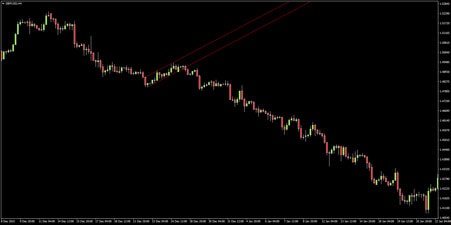
Bear Flag – Bearish Continuation Pattern:
The last continuation pattern we will look at is the Bear Flag. The opposite of the Bull Flag, characterized by a series of parallel higher lows and higher highs within a dominant down trend:

Traders will look to enter short once the lower parallel breaks. Just like the Descending Triangle, these patterns can lead to some fierce bearish continuation – in this case, GBPUSD declines over 800 pips in less than a month.
The Take Away: Chart patterns are often high probability, high reward trades that offer the trade clear entry and stop loss levels. Patterns are confirmed when the relevant line breaks – not before – wait for the breakout.
Read Technical Analysis – Price Action Trading (Part 3)
Source: VT Markets – VT Markets | 50% Welcome Bonus