– EUR/USD has been struggling to gain traction following Thursday’s drop.
– ECB refrained from committing to a 50 bps rate hike in September.
– Focus shifts to Consumer Price Index (CPI) data from the US.
EUR/USD has failed to stage a meaningful rebound after having lost more than 100 pips on Thursday. The pair stays within a touching distance of 1.0600 early Friday and a hot inflation report from the US could cause it to suffer additional losses ahead of the weekend.
The European Central Bank (ECB) left the policy rates unchanged as expected following the June policy meeting. The bank unveiled that they plan to hike rates by 25 basis points. Regarding the futures rate increases, the ECB refrained from committing to a 50 bps hike in September and caused the shared currency to lose interest. Moreover, the bank lowered growth forecasts for 2022 and 2023 to 2.8% and 2.1%, respectively, from 3.7% and 2.8%.
When asked about fragmentation risks, ECB President Lagarde noted that they will make sure fragmentation will be avoided during the monetary policy transition but acknowledged that the subject was not on the table at this meeting.
Later in the session, the US Bureau of Labor Statistics will release the Consumer Price Index (CPI) data. On a yearly basis, the CPI is expected to stay unchanged at 8.3% in May. The Core CPI, which strips volatile food and energy prices, is forecast to decline to 5.9% from 6.2% in April.
Given the ECB’s hesitancy, stronger-than-expected CPI readings could remind investors of the policy divergence with the Fed and trigger another leg lower in EUR/USD. On the other hand, a soft inflation report should cause investors to book their profits ahead of the weekend and help EUR/USD stage a rebound.
US Consumer Price Index May Preview: Fed policy is set but there is room for surprise.
EURUSD Technical Analysis
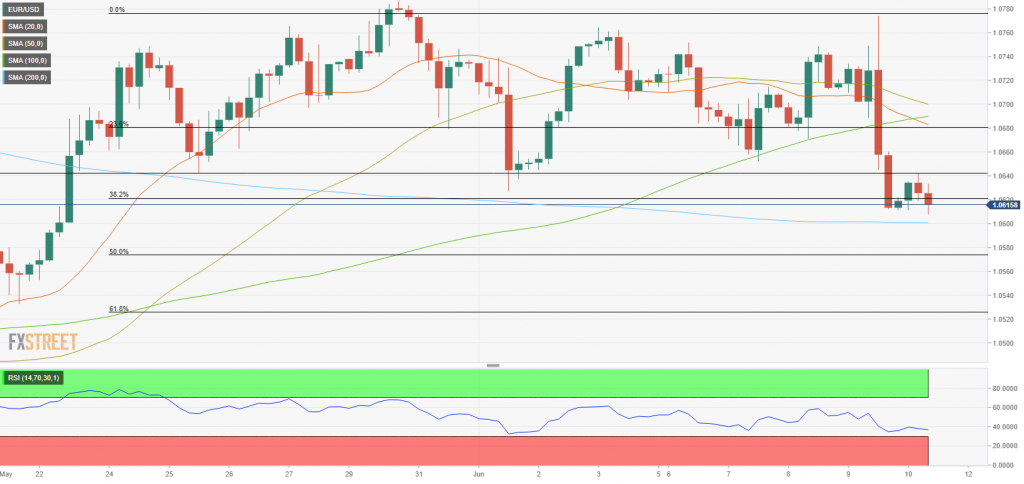
The 200-period SMA on the four-hour chart forms dynamic support at 1.0600. In case the pair falls below that level and starts using it as resistance, it could target 1.0570 (Fibonacci 50% retracement of the latest uptrend) and 1.0520 (Fibonacci 61.8% retracement) next.
On the upside, 1.0650 (static level) aligns as first resistance ahead of 1.0680 (Fibonacci 23.6% retracement) and 1.0700 (psychological level, 100-period SMA).
Meanwhile, the Relative Strength Index (RSI) indicator on the four-hour chart stays near 40, suggesting that there is more room on the downside before the pair turns technically oversold.
Source: Eren Sengezer – FXStreet
Read Bitcoin Weekly Forecast: There’s a BTC price crash looming