
– GBP/USD has advanced beyond 1.2300 at the start of the week.
– Risk flows dominate the financial markets early Monday.
– Next short-term resistance for the pair is located at 1.2360.
GBP/USD has gained traction early Monday and touched its highest level in 10 days above 1.2300. The near-term technical outlook suggests the pair looks to stretch higher but investors might refrain from committing to additional pound gains amid political jitters.
UK parliament members will vote on legislation that would allow ministers to rewrite parts of the port-Brexit deal and remove checks on goods entering Northern Ireland from the rest of the UK. When legislation was proposed, the European Union voiced its opposition and said that it would violate international law. According to BBC, British Prime Minister Boris Johnson said on Monday that he was hoping to turn that legislation, if approved, into law by the end of the year.
Nevertheless, risk flows remain in control of markets so far on the day with the UK’s FTSE 100 Index rising 0.7% on a daily basis. Additionally, US stock index futures are up between 0.4% and 0.75%. Brexit-related headlines, however, could cause the mood to sour and weigh on GBP/USD.
Advertisement

Later in the day, May Durable Goods Orders will be featured in the US economic docket. Market participants will pay close attention to the Pending Home Sales data as well, which is expected to show a 4% decline in May. A bigger-than-expected decrease in that data could cause investors to move away from risk-sensitive assets and help the dollar gather strength.
GBPUSD Technical Analysis
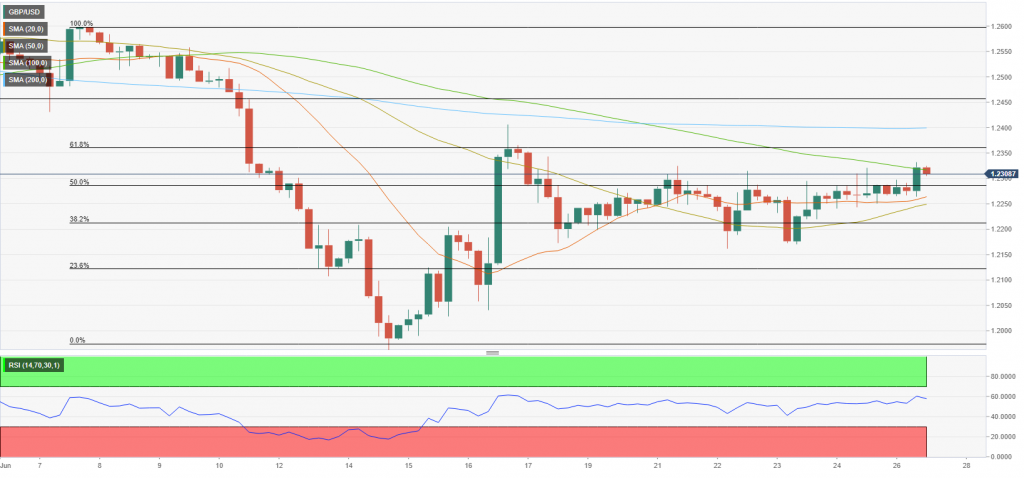
GBP/USD is facing next resistance at 1.2360, where the Fibonacci 61.8% retracement of the latest downtrend is located. In case the pair manages to clear that hurdle, it could target 1.2400 (200-period SMA on the four-hour chart) and 1.2460 (static level, former support).
On the flip side, 1.2280 (Fibonacci 50% retracement) aligns as first support before 1.2250 (50-period SMA) and 1.2200 (Fibonacci 38.2% retracement).
In the meantime, the Relative Strength Index (RSI) indicator is holding comfortably above 50, suggesting sellers remain on the sidelines for the time being.
Source: Eren Sengezer – FXStreet
Read Indices rallying but be careful – G7 to cap the price of crude? JPY still weak [Video]
🪙 Faucet BTC - Earn Free Satoshi
Just enter your BTC address, claim free satoshi, and once your balance hits 1000 satoshi, we will send it to your wallet automatically.