

(Eren Sengezer – FXStreet)
– GBP/USD has reclaimed 1.1800 following Wednesday’s choppy action.
– The pair could face stiff resistance at 1.1870.
– Wall Street’s main indexes remain on track to open decisively higher.
GBP/USD staged a rebound during the American trading hours on Wednesday but ended up closing the day in negative territory. With risk flows returning to markets early Thursday, the pair has gathered bullish momentum and advanced toward 1.1850. GBP/USD is closing in on the 1.1870 resistance and it needs to clear that hurdle to remain attractive to bulls.
Mixed macroeconomic data releases from the US failed to trigger a significant market reaction on Wednesday but the US Dollar Index struggled to extend its rally with investors refraining from making large bets ahead of the Jackson Hole Symposium.
The improving market mood on China’s decision to provide fiscal stimulus to revive the economy helped global equity indexes gain traction and made it difficult for the dollar to find demand early Thursday.
As of writing, the UK’s FTSE 100 Index was up 0.4% on the day and US stock index futures were gaining between 0.4% and 0.6%. In case Wall Street’s main indexes start the day in positive territory, the greenback could lose interest and open the door for additional gains in GBP/USD.
The US economic docket will feature the US Department of Labor’s weekly Initial Jobless Claims data and the US Bureau of Economic Analysis’ second estimate for the annualized Gross Domestic Product (GDP) growth in the second quarter. Ahead of the highly-anticipated Jackson Hole Symposium, however, these data are unlikely to impact the dollar’s valuation in a significant way.
FOMC Chairman Jerome Powell is scheduled to speak on Friday but Fed policymakers are likely to give interviews on the sidelines of the event. According to the CME Group FedWatch Tool, there is a 55% probability of a 75 basis points rate hike in September. In case Fed officials steer the markets toward a 50 bps hike at the next meeting, that could hurt the dollar and vice versa.
GBP/USD Technical Analysis
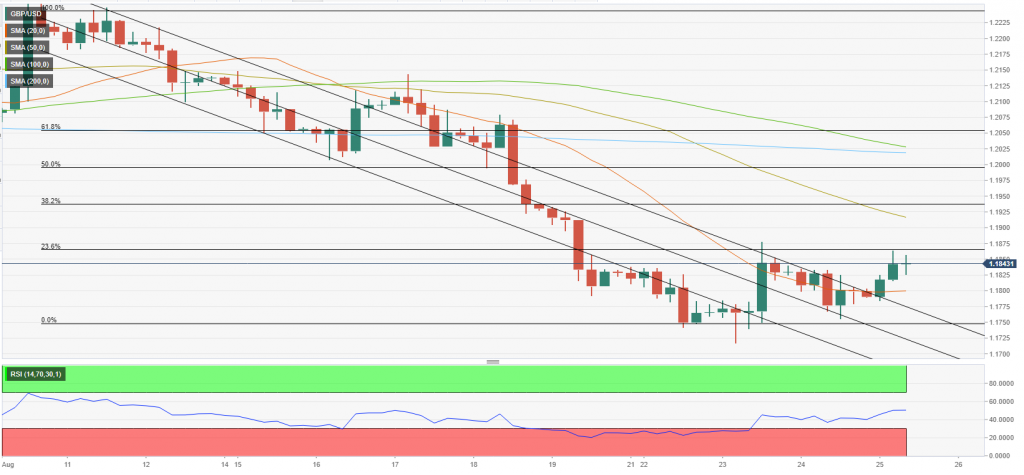
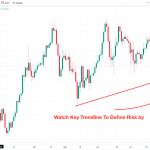
The near-term technical outlook suggests that the pair has managed to shake off the bearish pressure. The Relative Strength Index (RSI) indicator on the four-hour chart holds near 50 and the last two four-hour candles closed above the 20-period SMA. Additionally, GBP/USD stays afloat above the descending regression channel coming from August 12.
On the upside, 1.1870 (Fibonacci 23.6% retracement of the latest downtrend) aligns as initial resistance. With a four-hour close above that level, additional recovery gains toward 1.1900 (50-period SMA, psychological level) and 1.1940 (Fibonacci 38.2% retracement) could be witnessed.
Key technical support is located at 1.1800 (20-period SMA, psychological level). If that level fails, sellers could take action and drag the pair lower toward 1.1750 (static level, end-point of the downtrend) and 1.1720 (Aug. 23 low).
Read All eyes on Fed at Jackson Hole
Related posts:
 GBPUSD Foreacst: Eyes fresh multi-year lows as dollar rally continues
 Soft US inflation boosts sentiment
 GBPUSD Forecast: Pound looks indecisive after hot UK inflation data
 GBPUSD Forecast: Next line of defense aligns at 1.1825
 GBPUSD inches to 29-month low, bears dominate [Video]
 How to trade the Jackson Hole symposium – EUR/USD Forecast
Policy support indispensable for China’s economic and financial recovery
How to trade the Jackson Hole symposium – EUR/USD Forecast
Policy support indispensable for China’s economic and financial recovery
 A euro deep below dollar parity is now likely