

EUR/USD Forecast: Euro recovery to remain limited ahead of key data
(Eren Sengezer – FXStreet)
– EUR/USD has gained traction following a quiet Asian session on Tuesday.
– The pair could struggle to extend its recovery in the short term.
– Investors might remain on the sidelines ahead of Wednesday’s key data releases.
After having registered modest gains on Monday, EUR/USD has stretched higher in the early European session and climbed above 1.0200. Ahead of the inflation data from Germany and the US on Wednesday, however, market participants could refrain from betting on further euro strength.
Citing a study conducted by the Institute for Employment Research (IAB), Reuters reported earlier in the day that Germany’s price-adjusted Gross Domestic Product is expected to be 1.7% lower in 2023 amid high energy prices and the war in Ukraine. The study also forecast that 240,000 fewer people in Germany will be employed in 2023. As of writing, Germany’s DAX 30 Index was down 0.4% on the day, pointing to a cautious market mood.
In case risk flows start to dominate the markets, the shared currency could start erasing its daily gains. On Monday, EUR/USD retraced a portion of its daily rebound in the late American session when Wall Street’s main indexes turned south, reflecting the pair’s sensitivity to risk perception.
In the second half of the day, the US Labor Bureau of Labor Statistics is expected to report that the Unit Labor Costs in the second quarter declined to 9.5% from 12.6% in the first quarter. Nevertheless, this data is unlikely to influence the market pricing of the Fed’s rate outlook in a significant way. According to the CME Group FedWatch Tool, there is now a 65% chance of the Fed raising the policy rate by 75 basis points.
EUR/USD Technical Analysis

EUR/USD is closing in on 1.0230, where the Fibonacci 38.2% retracement of the latest downtrend is located. Even if the pair manages to rise above that level, it could meet strong resistance at 1.0250 (200-period SMA on the four-hour chart). Only a four-hour close above that level could be seen as a bullish development and open the door for an extended recovery toward 1.0300 (psychological level, Fibonacci 50% retracement).
On the downside, initial support is located at 1.0200 (100-period SMA, 50-period SMA). If sellers flip that level into resistance, 1.0150 (Fibonacci 23.6% retracement) and 1.0100 (psychological level, static level) could be seen as the next bearish targets.
EUR/USD: Holidays mood, no data, low volatility
In extremely narrow range trading remains the pair as the August holiday period coupled with the absence of major Economic data prevents traders from taking significant positions.
The market is showing a wait-and-see attitude ahead of tomorrow’s announcements on the path of inflation in Germany and US.
The gap that has been created between the European Central Bank and the Fed regarding the policy they follow in raising interest rates may receive new data and new bets for if this will remain , will be limited or expanded.
The significant increase in energy prices in recent months has added inflation pressures in the world’s largest economies, and the effort by central banks to control these pressures with one of the most important tools the increases in key interest rates , is one of the most important factors that influencing exchange rates.
The US Federal Central Bank is currently following a more aggressive policy than the ECB . This has led to higher interest rates with US bond yields remaining at attractive levels . This is considered one of the main reasons for the dollar’s dynamics.
Although in a thin market there are often opportunities to temporarily break some levels and execute ” stop loss ” orders , the more likely scenario is that the market will remain in a narrow trading range until tomorrow ahead of the important announcements.
Silver is close to TL system resistance and 61.8%
(Ian Coleman M.S.T.A. – Educate2accumulate)
Silver
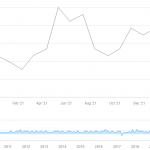
Overview (DXY)
The US Dollar (DXY) traded to the highest level in 237 months in July before taking a corrective move to the downside. This coincided with a base being put in on Silver at 18.15.
There are three downside barriers in Silver. The TL system highlights 105.00 and 104.70 as support, while the completion of an AB leg, in a large cypher BAT formation, is located at 104.91.

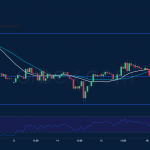
Silver daily chart
We can clearly see 5-waves to the downside. Elliott Wave enthusiast will see this as the completion of a bearish count. This would suggest that the next wave higher is the complex correction consisting of five and three wave counts.
TL system highlights resistance at 20.83

Silver eight-hour chart
We can see a 5-wave count to the upside. The TL system highlights resistance at 20.83. A 61.8% Fibonacci resistance level is located at 20.83 (from 22.51-18.11).

Conclusion
I am looking for limited upside, selling at 20.83, for a move lower in the BC leg towards 18.50.
Read US ready to sign Iran nuclear deal?
Related posts:
 Elliott Wave analysis: Correction on kiwi searching for a support
 US Inflation Preview: Finally signs of peak inflation? Three scenarios for Core CPI and the dollar
 Sentiment turns sour into Netflix earnings [Video]
 Euro rebounds ahead of this week’s ECB meeting [Video]
 UK inflation heading for 11%+ readings later this year as food and energy costs rise
 ECB preview: A question of balance as Draghi quits
Vlad turns on the natural gas, Europe exhales
The commodities feed: EU energy ministers set to meet
ECB preview: A question of balance as Draghi quits
Vlad turns on the natural gas, Europe exhales
The commodities feed: EU energy ministers set to meet